Decomposition
Overview
The Decomposition feature is used to decompose the time series data into three components: Trend, Seasonality and Remainder.
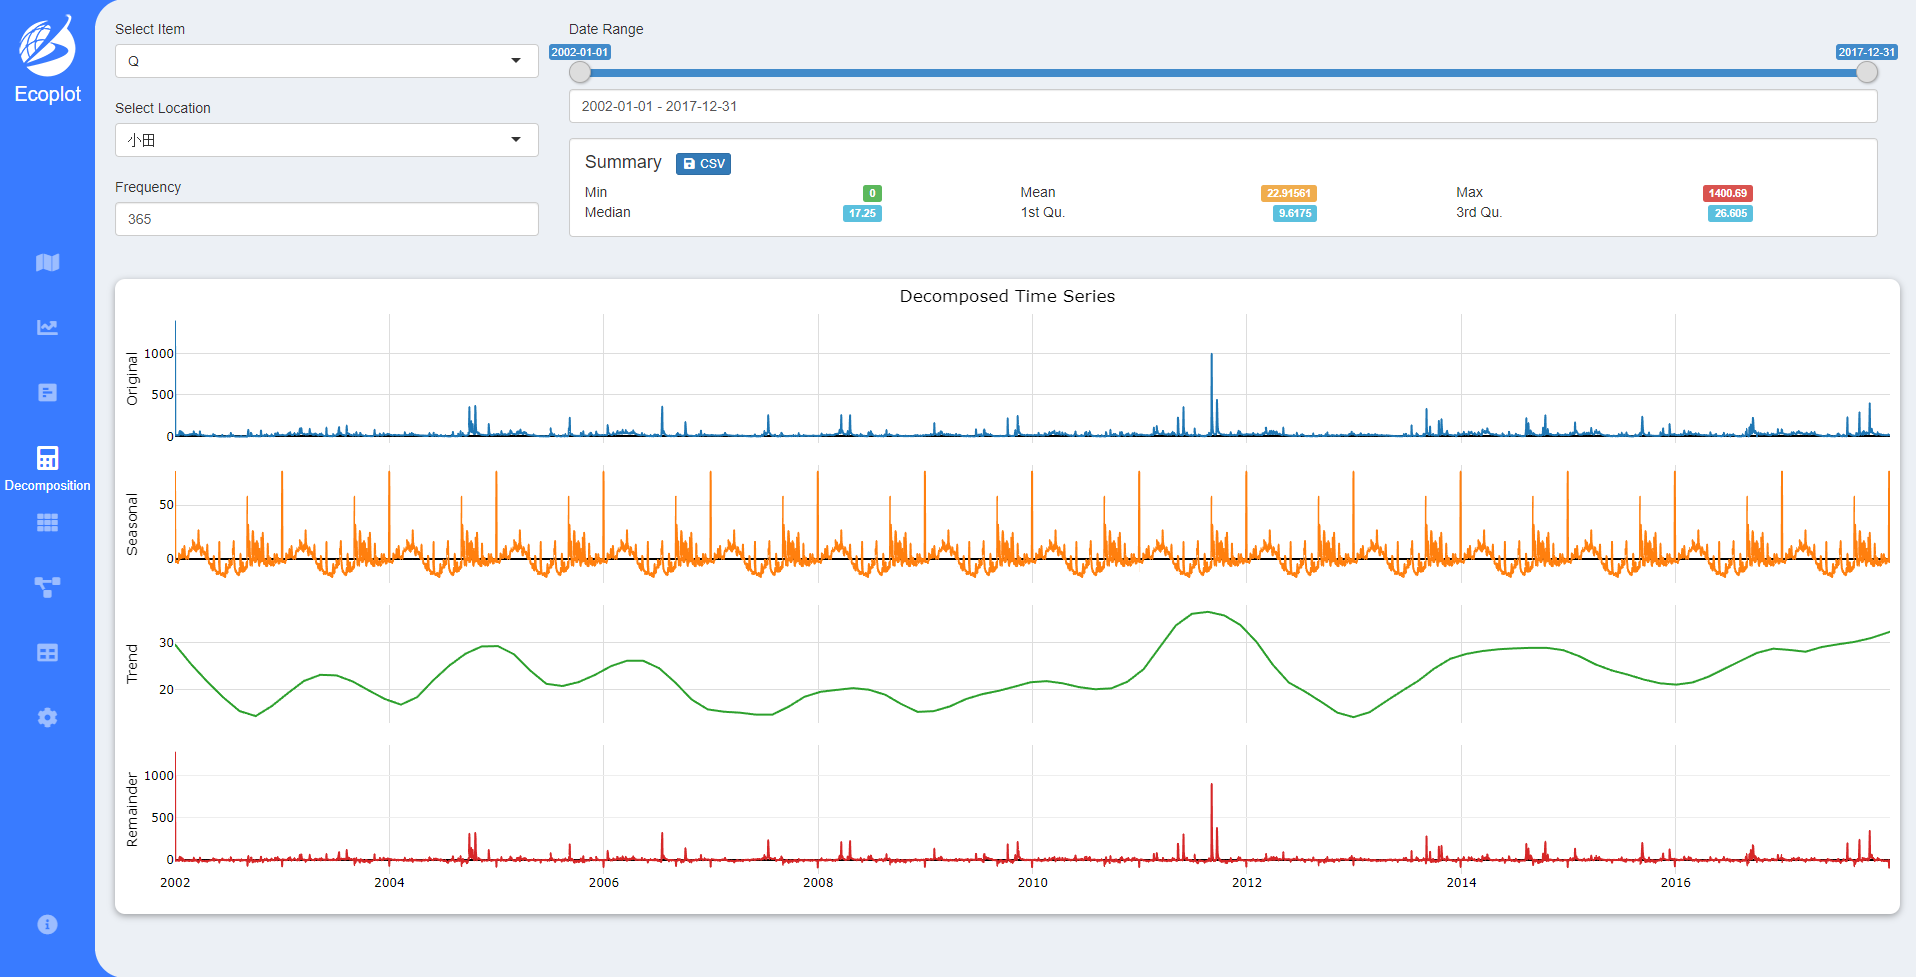
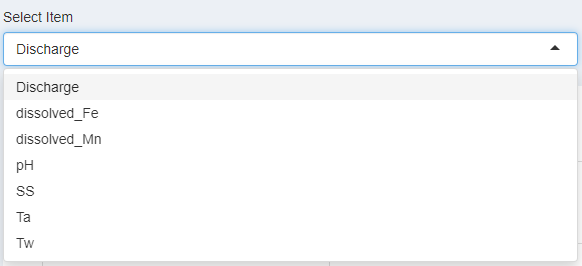
Select item
You can specify the item data to use for decomposition.
Date range
You can select a date range to filter the time series data.

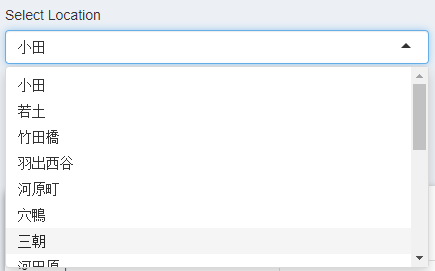
Station selection
You can specify a station to perform the decomposition.
Summary
From your selected item, station and date range, the system will calculate the summary of the data (minimum, maximum, mean, median, first, and third quartiles).
Download CSV data
You can download the current filtered data by clicking on the CSV button.

Decomposition chart
There are 4 parts of the decomposition chart:
- Original: The original data of the time series.
- Seasonal: The component that reflects the seasonal variation of the time series over a fixed and known period, e.g. season, day of week, etc.
- Trend: The component which reflects the long-term progression of the time series, which shows a continuous increase or decrease in the data.
- Remainder: The random variation representing the irregular component (or ‘noise’) of the time series. It is the residual of the time series after all other components are removed.
