Ecoplot® Cloud Service
A modern interactive data visualisation platform
Connect map and time-series
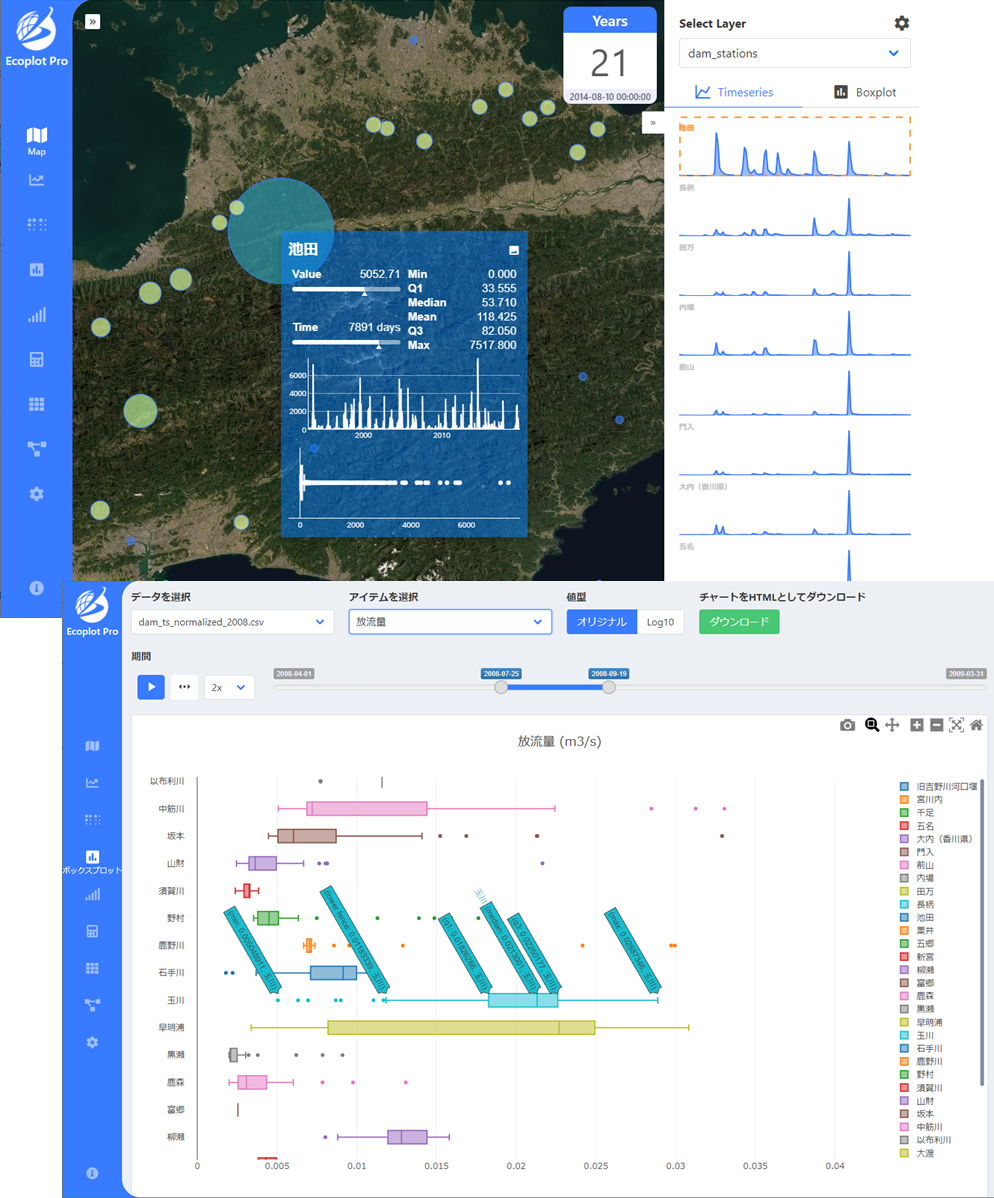
In order to efficiently identify features and trends in Big data, it is important to make a strong link between spatially and temporally varying information.
‘Ecoplot’ visually provides this link between the geographical location and time series data plots, thus helping to identify regional features and trends.
All basic features are included such as zooming in and out of data through mouse control, along with more advanced features like component decomposition and correlation analysis.
As long as measurement points and time series data are available, data from any field can be displayed in an easy-to-understand manner, showing unique insights.
By simply importing a data set (e.g. as CSV format) anyone can feely get their interactive visualisations.
Suggestions and hypotheses derived from the data can be considered for further analysis.